-->

Pages

Thursday, March 26, 2015

Louisiana can't find their boot

Terra MODIS true color imagery 2/15/15


Google Earth Imagery 4/9/13


Landsat 8 true color imagery mult images stitched from throughout Feb


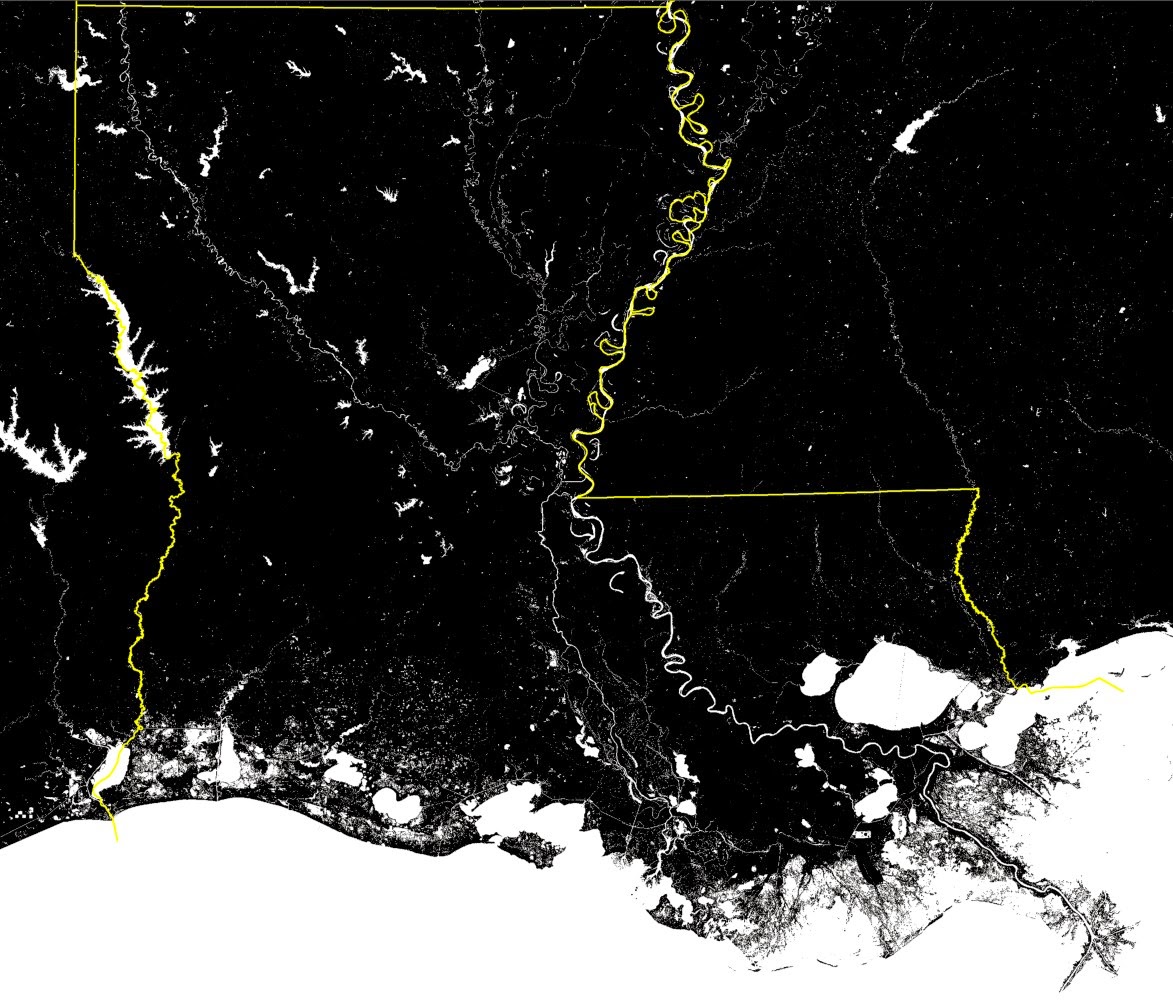
USGS 2011 National Land Cover Database data, showing how much wetland is left in Louisiana.

Louisiana doesn't look like the maps I memorized growing up anymore. Loss of wetlands has caused a dramatic change in the coastline. Imagery from Landsat 8, Terra, and especially the USGS dataset show the true story, but it is interesting to me that even Google Earth shades the imagery to show an image that we are used to seeing. Aerial imagery such as this can be a powerful tool to show what the situation is really like. 


There are a lot of reasons the wetlands are receding, chemicals that are dumped in the Mississippi River have caused problems in the area, as well as poor land management. Loss of wetlands allows for stronger hurricanes to hit the mainland, not to mention the loss of habitat to hundreds of animals

Here is an article that outlines the whole story - 
https://medium.com/matter/louisiana-loses-its-boot-b55b3bd52d1e


Wednesday, March 25, 2015

Lidar Utah


Monday, March 23, 2015

Wasatch Front Temperature


Summer of 2013 was one of the hottest on record for Utah. Normally the locals escape to the canyons for relief, since it is usually 20 degrees cooler than the valleys. But 20 degrees cooler than 107 is still very hot. Nighttime lows only got to about 75.  In an area that is not used to such extreme heat, it was difficult for many to cope. 

Images above show The Wasatch Front and Great Salt Lake on July 22, 2013. First image is a true color, second shows night land surface temperature represented by a color ramp and the third is daytime temperature. 

The bodies of water heat up and cool down slower than land, so during the day the water is cooler than it's surroundings and during the night it is warmer. 

You can also notice that the mountains are much cooler than the low valleys, still warm by Wasatch Front standards, but it beats sitting in triple digit heat all day. 

Grand Tetons

Grand Tetons, Jackson Lake, & Jackson WY
Landsat 8 6-5-4 False color composite
5-25-14

Thursday, March 19, 2015

Lidar Salt Lake City


Introducing downtown Salt Lake City through the eyes of Lidar. This map
was made from public Lidar data from the AGRC. It is based off of a DSM 
(Digital Surface Model) that has been processed with a hillshade. It reminds 
me of a classic plat map or some of those city word art maps. Salt Lake's
unique geography really helps bring out this feeling. This will hopefully be
the first of many as I delve into other cities datasets and try to make similar ones. 
Please let me know if there are any cities in particular that you would like me to look 
at first. Also, if you are interested in a nice print version just send me a message or 
leave a comment below.

PS ~ This my first guest post on this blog. Thank you for setting it up Adam

Thursday, March 12, 2015

Refinería Cardón Complex, Venezuela


Flare stack


Refinería Cardón Complex, Venezuela


These images show the usefulness of detecting wavelengths beyond the visible spectrum. The top image shows what would be considered a 'True Color image' or what one would see with the naked eye. The bottom image is reassigning the colors based on different wavelengths. Instead of Red Green and Blue showing the wavelengths that are Red Green and Blue, the values are showing different wavelengths that we can not detect with our own eyes.  This band combination is called a 6-5-4 false color composite. 

Red - Shortwave Infrared I (Band 6)
Green - Near Infrared (Band 5)
Blue - Red (Band 4)

This composite is especially useful for detecting vegetation, since vegetation reflects much more Near Infrared light than the others. You can see bright green in the areas that have vegetation. In this case it is also useful for detecting flare stacks in oil refineries. Those are the bright orange spots. I was snooping around in Venezuela using Landsat 8 imagery when I found this. It is one of the largest refineries in the world in terms of production. This image was taken on 2-18-15