

Showing posts with label USGS. Show all posts
Showing posts with label USGS. Show all posts
Monday, April 27, 2015
Chile Volcano Time Series


Friday, April 24, 2015
Calbuco Volcano Chile Imagery
 |
| Terra image morning of 4-24-15 Trail of ash is spread out over 100 miles |
 |
| Aqua image afternoon of 4-24-15 |
 |
| Google Earth Image of Calbuco pre-eruption |
The Calbuco volcano in southern Chile has erupted twice in the space of a few hours - having lain dormant for decades.
Footage from the area shows a huge column of lava and ash being sent several kilometres into the air.
The authorities have declared a red alert and evacuated more than 4,000 people within a 20km (12 mile) radius.
The Calbuco volcano is one of the most active in Chile, but its eruption took officials in the area by surprise.
Alejandro Verges, an emergency director for the region, said Calbuco had not been under any special form of observation.
 |
| Source:http://ichef.bbci.co.uk/news/624/media/images/82521000/jpg/_82521685_026883262-1.jpg |
Thursday, April 9, 2015
Lake Superior Ice Jam

I was listening to a report on NPR yesterday about ice jamming up a shipping route on Lake Superior. Every year when ice forms on the lake, icebreakers are needed to create shipping lanes for the passing container ships. The lanes around Whitefish Bay (in focus below with a 6-5-4 false color composite) have become completely covered due to drifting ice from earlier storms that compacted all the ice on the eastern part of Lake Superior. Some of the ice was reported to be eight feet thick as pieces piled on top of one another forming bigger chunks.

The shipping lanes are being navigated through and cleared by a team of US and Canadian vessels. In this image you can faintly see the shipping lane which runs about 37 miles through Whitefish Bay alone.
Source: NPR, USGS, Google Earth Engine
Thursday, March 26, 2015
Louisiana can't find their boot
 |
Terra MODIS true color imagery 2/15/15 |
 |
Google Earth Imagery 4/9/13 |
 |
Landsat 8 true color imagery mult images stitched from throughout Feb |
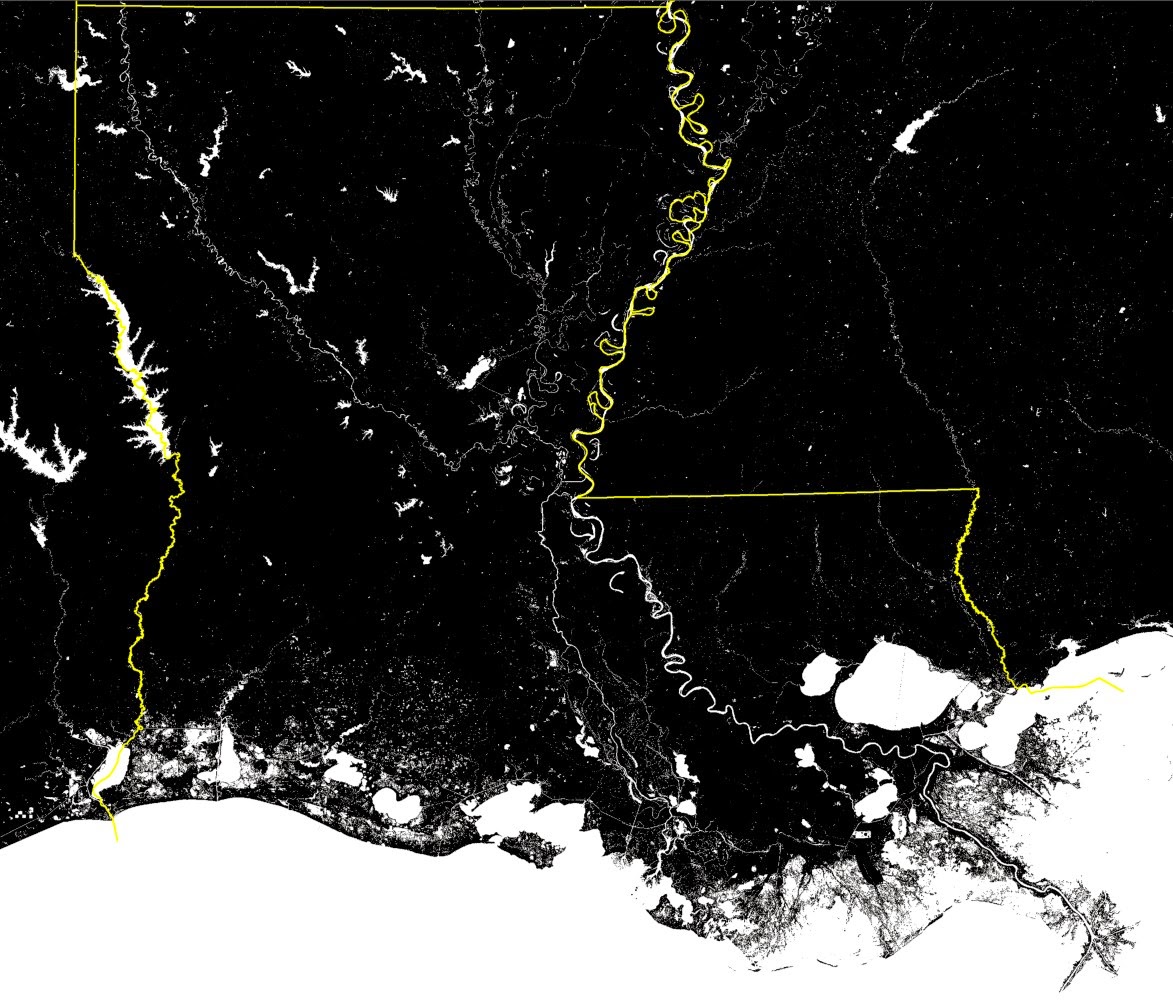 |
| USGS 2011 National Land Cover Database data, showing how much wetland is left in Louisiana. |