-->

Pages

Showing posts with label Landsat 8. Show all posts

Friday, January 6, 2017

Canyon Wildfire Assessment at Vandenberg Air Force Base

I worked on this project recently with Haoyu Li at Clark University. Vandenberg Air Force Base had a quick burning fire pass by one of its rocket launch pads this past September. The fire started by an unknown source in the hills behind the launchpad and at its peak had over 1,000 fire fighters working to contain the fire. We used Landsat 8 for Pre and Post fire imagery, classification, and for NBR. We created training sites and used Maximum Likelihood Classification.

Pre Fire: Oct 1, 2015 Landsat 8

Post Fire: Oct. 3, 2016 Landsat 8

Pre Fire Maximum Likelihood Classification

Post Fire Maximum Likelihood Classification

Normalized Burn Ratio or NBR
Landsat 8 uses bands 5 and 7

Shows burn severity and change 


Source: Landsat 8

Friday, March 18, 2016

Lake Shasta Water Levels Rising


The drought in California has been drying up reservoirs across the state over the last few years. This year was predicted to have a large El Nino effect this winter and spring, but it has not produced as much as hoped. Until earlier this month it had been a typical, almost average winter with snow levels averaging around 90% across the state of California. Over the last few weeks several rain and snow storms have passed through Northern California helping Lake Shasta rise to 86% capacity with over 1.8 million acre-feet of water pouring in since the middle of January. El Nino has been very kind to Northern California as of late and we hope it will continue! Check out the slider below to see the difference between water levels at Lake Shasta from last August and its current condition.


Sources: California Dept of Water Resources Data Exchange Center
Imagery: Landsat 8 via Google Earth Engine

Thursday, April 9, 2015

Lake Superior Ice Jam


I was listening to a report on NPR yesterday about ice jamming up a shipping route on Lake Superior. Every year when ice forms on the lake, icebreakers are needed to create shipping lanes for the passing container ships. The lanes around Whitefish Bay (in focus below with a 6-5-4 false color composite) have become completely covered due to drifting ice from earlier storms that compacted all the ice on the eastern part of Lake Superior. Some of the ice was reported to be eight feet thick as pieces piled on top of one another forming bigger chunks.  


The shipping lanes are being navigated through and cleared by a team of US and Canadian vessels. In this image you can faintly see the shipping lane which runs about 37 miles through Whitefish Bay alone.


Source: NPR, USGS, Google Earth Engine

Thursday, March 26, 2015

Louisiana can't find their boot

Terra MODIS true color imagery 2/15/15


Google Earth Imagery 4/9/13


Landsat 8 true color imagery mult images stitched from throughout Feb


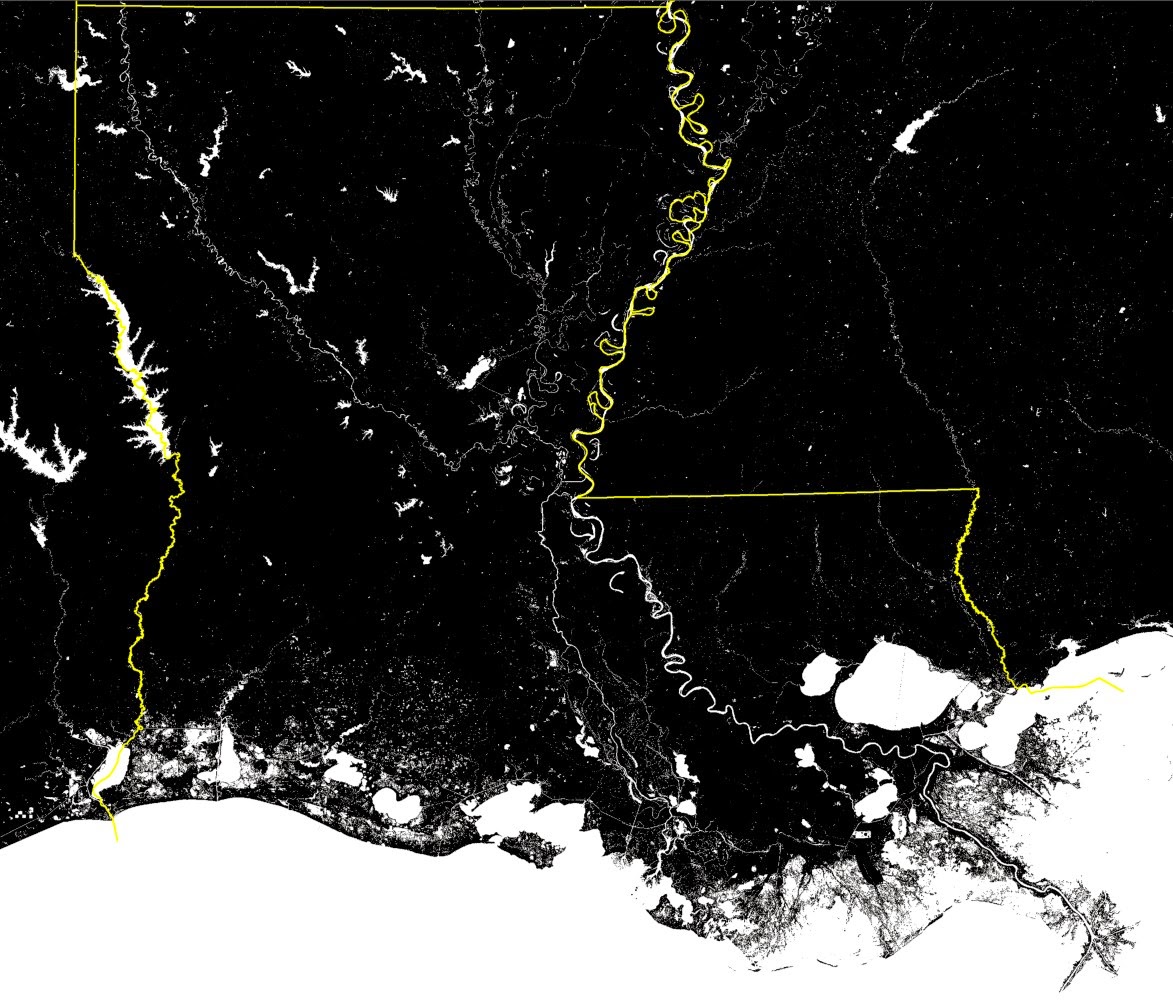
USGS 2011 National Land Cover Database data, showing how much wetland is left in Louisiana.

Louisiana doesn't look like the maps I memorized growing up anymore. Loss of wetlands has caused a dramatic change in the coastline. Imagery from Landsat 8, Terra, and especially the USGS dataset show the true story, but it is interesting to me that even Google Earth shades the imagery to show an image that we are used to seeing. Aerial imagery such as this can be a powerful tool to show what the situation is really like. 


There are a lot of reasons the wetlands are receding, chemicals that are dumped in the Mississippi River have caused problems in the area, as well as poor land management. Loss of wetlands allows for stronger hurricanes to hit the mainland, not to mention the loss of habitat to hundreds of animals

Here is an article that outlines the whole story - 
https://medium.com/matter/louisiana-loses-its-boot-b55b3bd52d1e


Monday, March 23, 2015

Grand Tetons

Grand Tetons, Jackson Lake, & Jackson WY
Landsat 8 6-5-4 False color composite
5-25-14

Thursday, March 12, 2015

Refinería Cardón Complex, Venezuela


Flare stack


Refinería Cardón Complex, Venezuela


These images show the usefulness of detecting wavelengths beyond the visible spectrum. The top image shows what would be considered a 'True Color image' or what one would see with the naked eye. The bottom image is reassigning the colors based on different wavelengths. Instead of Red Green and Blue showing the wavelengths that are Red Green and Blue, the values are showing different wavelengths that we can not detect with our own eyes.  This band combination is called a 6-5-4 false color composite. 

Red - Shortwave Infrared I (Band 6)
Green - Near Infrared (Band 5)
Blue - Red (Band 4)

This composite is especially useful for detecting vegetation, since vegetation reflects much more Near Infrared light than the others. You can see bright green in the areas that have vegetation. In this case it is also useful for detecting flare stacks in oil refineries. Those are the bright orange spots. I was snooping around in Venezuela using Landsat 8 imagery when I found this. It is one of the largest refineries in the world in terms of production. This image was taken on 2-18-15

Thursday, December 25, 2014

Crying: Acceptable at funerals and the Grand Canyon


Landsat 8 True color composite mosaic created from imagery dated 9-30-14 & 11-25-2014
Grand Canyon, AZ
Over 5 millions people go to sight-see the Grand Canyon every year. The Grand Canyon is 277 miles long, up to 18 miles wide, and is over 6,000 feet deep. It is estimated that over 2 billion years of earth's geologic history is exposed from the erosion caused by the Colorado River. The Colorado River started flowing through this area about 17 million years ago. The Grand Canyon is an easy landmark in case you are ever in orbit around the earth with no reference. You can only hope you'll be found in that situation one day. 

The Kaibab Plateau is the stretch of green that borders the canyon to the North. There are several species that are endemic to the plateau. 

Mosaic of Landsat 8 Imagery 11-15-2014 and USGS National Elevation Dataset 1/3 arc-second
Dark and light orange correspond with low and high elevation respectively
Same extent as imagery shown above

Monday, December 22, 2014

East Michigan Ice

Landsat 8 false color composite - East coast of Lake Michigan April 7, 2014
Spring Lake to the north and South Haven to the south.
Ice coverage shown as cyan. Vegetation shown as green.
Resolution ~30m
 This last winter was not your average season. The west experienced warmer than average temperatures and little precipitation while the east was stuck dealing with an 'arctic blast'. This caused frigid temperatures for most of the winter months and probably helped jetBlue post profits as they ferried everyone down to Florida and the Caribbean to enjoy some sun.

As a result of the high precipitation and low temperatures Lake Michigan had the highest ice coverage on record since 1973. The precipitation brought much needed relief to the area and I'm sure marina owners and shipping managers won't mind the higher lake levels.

Aqua false color composite - East coast of Lake Michigan April 8, 2014
Wabaningo to the north and Bridgman to the south.
  Ice coverage shown as cyan. Vegetation shown as green.
Resolution ~ 250m